
The infinity pool photographs beautifully. The absence of a mortgage is harder to put in a listing.
Yet that invisible amenity helps explain why a housing market can feel punishing to one buyer and perfectly navigable to another. They can like the same house, agree on its price and still face profoundly different purchases.
One needs a mortgage. The other can pay the full price upfront.
A recent Wall Street Journal headline about luxury homes and cash points to that divide. The useful question goes beyond how the wealthy shop: what happens to the market’s signals when some buyers can ignore the borrowing cost that stops others?
How Does the Same $400,000 Loan Get $371 More Expensive a Month?
Freddie Mac’s weekly survey put the average 30-year fixed mortgage rate at 7.40% on October 15, 2026. An average is not a personal loan offer. But it makes the arithmetic behind the divide tangible.
Take a hypothetical $500,000 purchase with 20% down and a $400,000, 30-year fixed loan. At 6%, the monthly principal and interest would be about $2,398. At 7.40%, it would be about $2,770: roughly $371 more each month for the same house and loan amount.
| Fixed rate | Monthly principal & interest |
|---|---|
| 6.00% | $2,398.20 |
| 7.40% | $2,769.52 |
| Difference | $371.32 per month |
Illustration; table rounded to the nearest cent: 360 equal monthly payments, no fees, points or mortgage insurance. Taxes, homeowners insurance, association dues and maintenance are additional. The 6% rate is a comparison assumption, not a current quote. The 7.40% figure matches Freddie Mac’s October 15 weekly average.
The cash purchaser avoids that mortgage payment, having committed the full purchase price upfront. That is a very expensive way to acquire immunity from this particular interest-rate problem. It is still immunity.
Luxury Prices Are Rising. Is That Your Housing Market?
Earlier this year, Redfin’s own MLS analysis found that median luxury sale prices rose 4.7% from a year earlier during the three months ending May 31, 2026. Its middle-priced comparison group rose 1.5%.
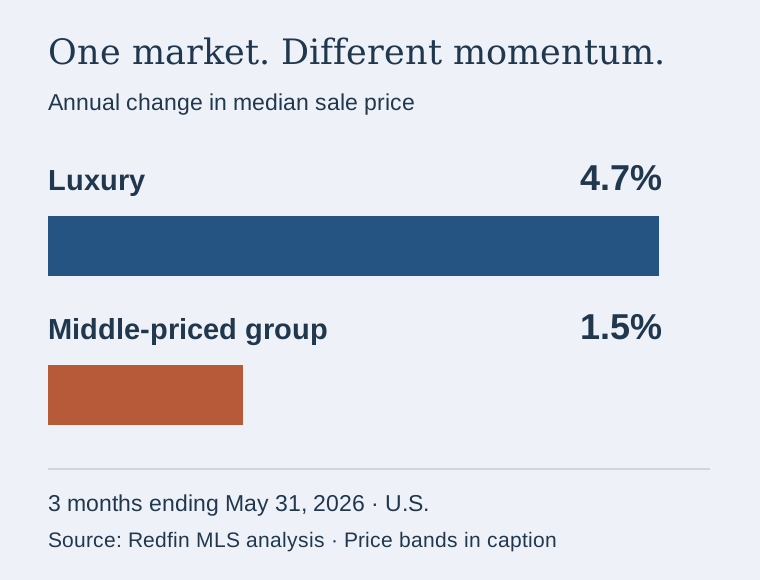
That comparison does not tell us how many of those buyers paid cash. Nor does a rising median establish that every individual home gained value. It shows that the tiers were behaving differently in that period. The mortgage arithmetic supplies one reason buyers with different resources can respond differently to the same rate environment.
Cash is not exclusively a billionaire’s trick, either. In NAR’s 2025 survey of primary-residence buyers, 30% of repeat buyers paid entirely in cash. That survey covers purchases from July 2024 through June 2025; it excludes investors and vacation homes.
A previous home can help finance the next one. The buyer arriving with sale proceeds and the renter building a down payment from earnings are not starting from the same place, even when they stand on the same porch.
Paid in Full. Why Are There Still So Many Bills?
The strongest objection to celebrating a mortgage-free purchase is also the most obvious: the money has to come from somewhere. Capital tied up in a house cannot simultaneously remain available for another use. Selling an investment or another property may carry costs of its own.
And the house keeps sending bills. A roof does not ask whether the owner borrowed. Neither does the insurance company.
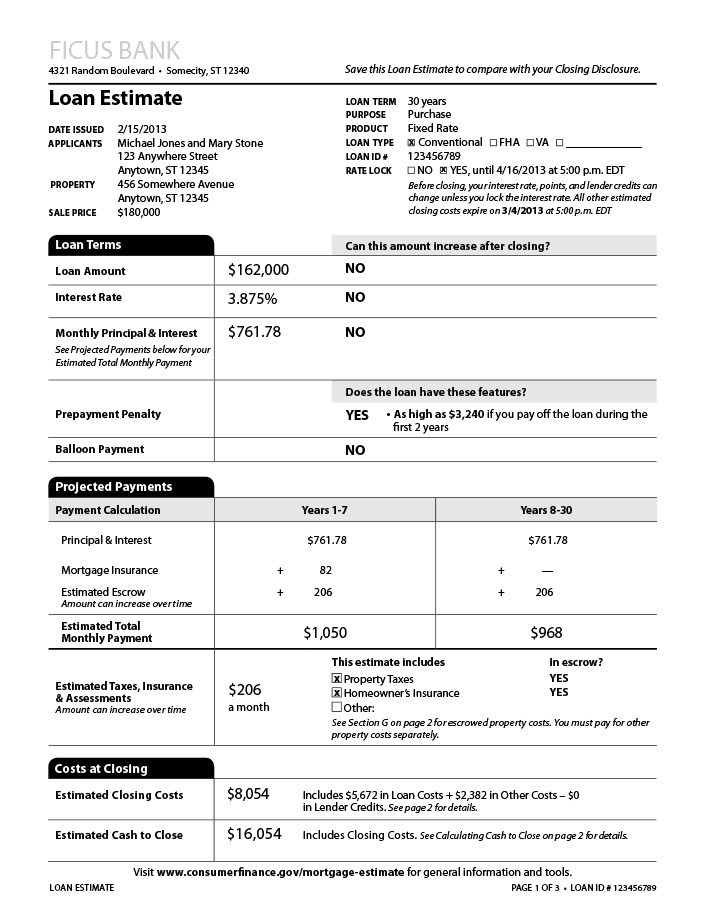
That makes this a story about unequal exposure to borrowing costs, rather than a recommendation to empty an investment account. A cash buyer can still overpay. A financed buyer can still make a sound purchase. What changes is which constraint gets the first vote.
Whose Housing Market Are You Looking At?
For a seller, a headline about booming luxury prices is not a comparable sale. The relevant question is who can buy this particular property, at this price, with the financing those buyers actually use.
For a buyer, a national median is not a monthly budget. Price can stay still while the cost of financing it moves sharply. That is why a market described as stable can feel as though it has become more expensive overnight.
The walk-in closet will still get a photograph. But the most consequential luxury may be the ability to walk past the mortgage desk.
Sources and method
- Freddie Mac, Primary Mortgage Market Survey, October 15, 2026: weekly national 30-year fixed average, not an individual quote.
- Redfin, luxury housing analysis, June 30, 2026, updated July 13: rolling three-month MLS analysis and price-band definitions.
- NAR, 2025 Profile of Home Buyers and Sellers release, November 4, 2025: primary-residence buyers surveyed about July 2024–June 2025 purchases.
- Consumer Financial Protection Bureau, Loan Estimate explainer: official historical sample form and payment categories.
Payment calculation: standard fixed-rate amortization, $400,000 principal, annual rate divided by 12 and 360 monthly payments. The example and interpretation are ours. The Journal link supplied the reporting lead; this article does not summarize its paywalled reporting.